Plastic Waste Colonialism

in Mexico

The objective of this platform is to provide a radiography of Plastic Waste Colonialism in Mexico. It is a consultation and dissemination tool about pollution and the problems caused by the export of plastic waste to Mexico and its use as a fuel in incineration, pyrolysis, co-processing, and other forms of waste to energy use in the country.


Data systematization, mapping, and platform design: Geocomunes / Geografía Septentrional

Research by the Colectiva Malditos Plásticos: Asociación Ecológica Santo Tomás, Fronteras Comunes, Red Mexicana de Acción Ecológica and GAIA. Publication: Spring 2023


What is Waste Colonialism?


We call waste colonialism the form of domination, exploitation, and environmental injustice that is generated through the transboundary shipment of waste from rich and powerful countries to those of the global South, where environmental regulation is laxer and the capacity for safe recycling is infinitely lower than in developed countries, as in the case of Mexico.

These are exports of contaminated and toxic waste that cannot be recycled cleanly; therefore, in many cases, they end up being burned.

Photo: GAIA.

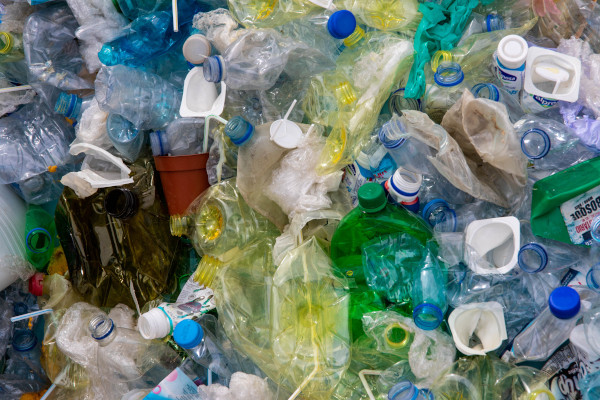
Plastic waste as a commodity in the context of Basel and the Plastics Amendment

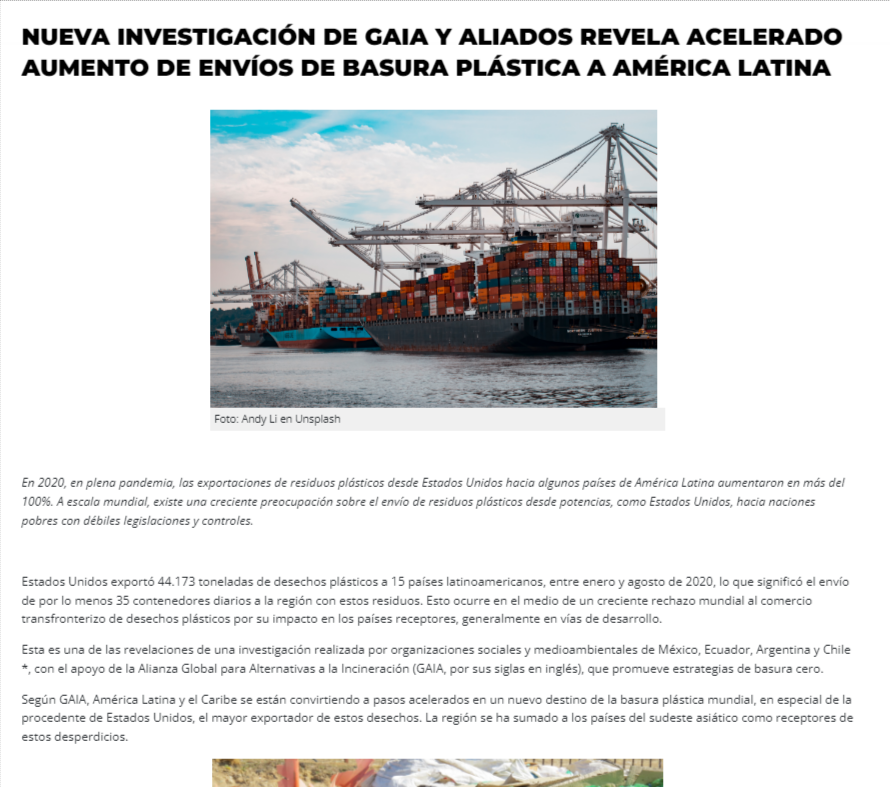
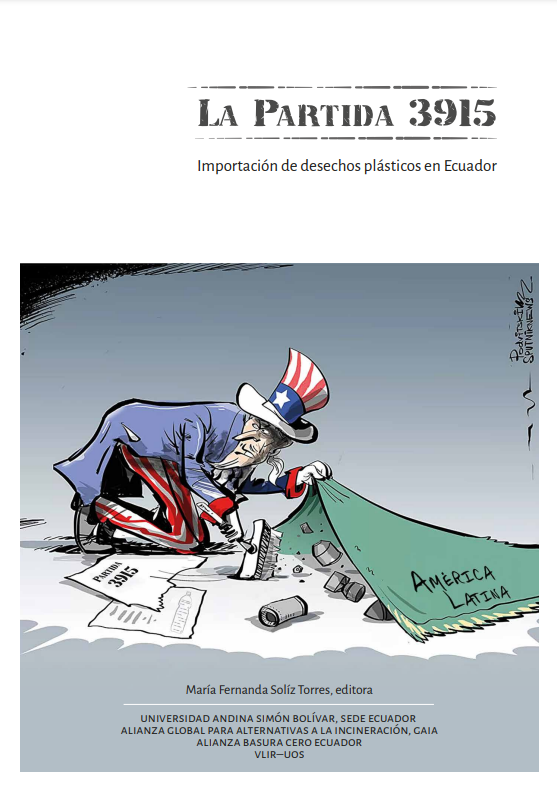
Effective January 1, 2018, China banned the import of plastic waste (tariff code 3915) because it is not amenable to recycling; because of its toxicity; and because it causes serious pollution problems and health damage in its territory. This measure forced the United States (USA) and other countries that are major generators of plastic waste to redirect their waste exports to less developed countries under the argument that they are exported for supposed recycling.

Exports of plastic waste to Mexico increased from 2018 to 2021 by 121%, despite the entry into force of the Basel Convention's Plastics Amendment in January 2021. However, official data from the Mexican government indicate that it was 2021 when the largest entry of these wastes into our country was reported.

The Basel Convention seeks to control the transboundary movements of hazardous wastes and their disposal. It is a binding instrument created as a global response to the alarming increase in the international trade of toxic wastes, and seeks to "protect, through strict control, human health and the environment against the harmful effects that may result from the generation and management of hazardous wastes and other wastes.” Mexico has been a signatory to the Basel Convention since 1989, which came into force in 1992.

The Plastics Amendment is a formal modification to the provisions of the Basel Convention that aims to address the high level of pollution generated by plastic waste worldwide, both in the marine environment and in the local populations of the poorest countries affected by the shipment of this waste.

Total exports of plastic waste to Mexico

2015201620172018201920202021
Volume (tons)58,24366,85774,61879,29178,538129,385175,586
Annual Growth14.8%11.6%6.3%-0.9%64.7%35.7%

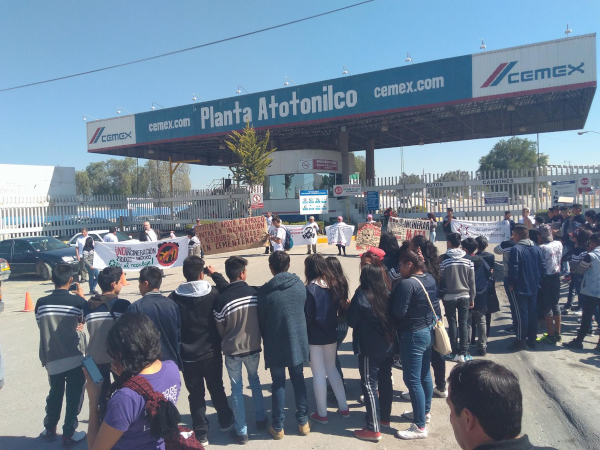
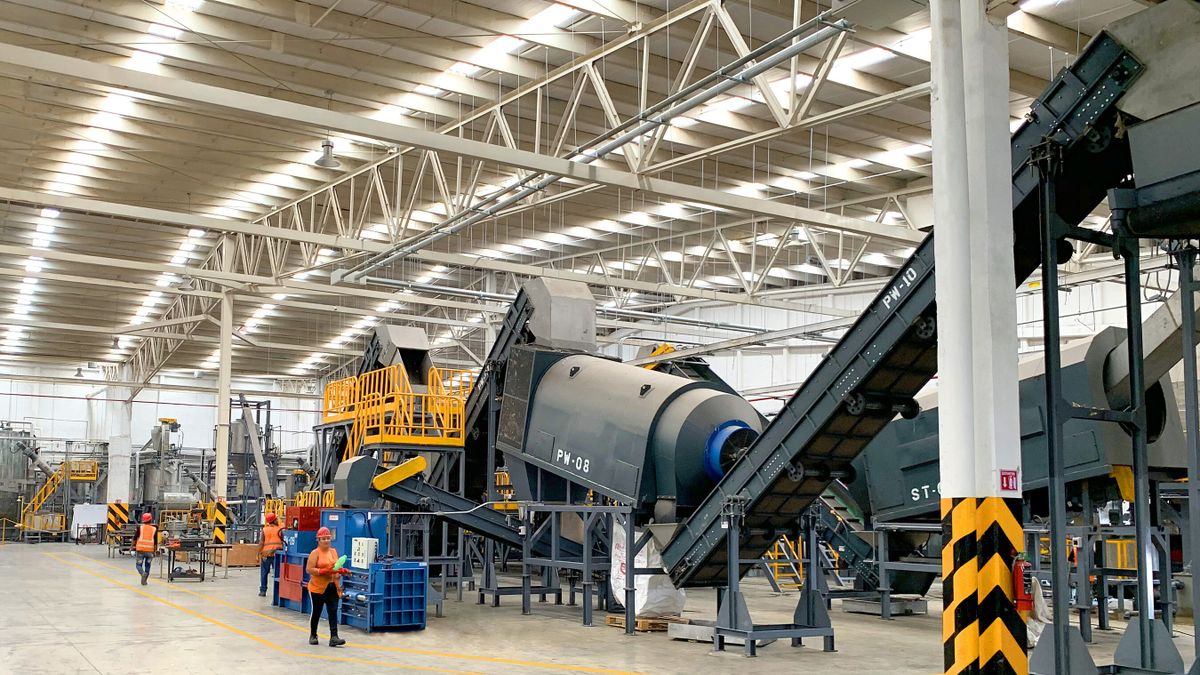
There are currently worldwide efforts to put an end to the plastic pollution crisis through a legally binding International Treaty on Plastics, which includes the complete life cycle of plastic for both terrestrial and marine environments.  However, the colonialism of plastic waste is wrongly promoted by the current government, by encouraging these toxic imports with the argument of economic reactivation, job creation, and currency exchange.

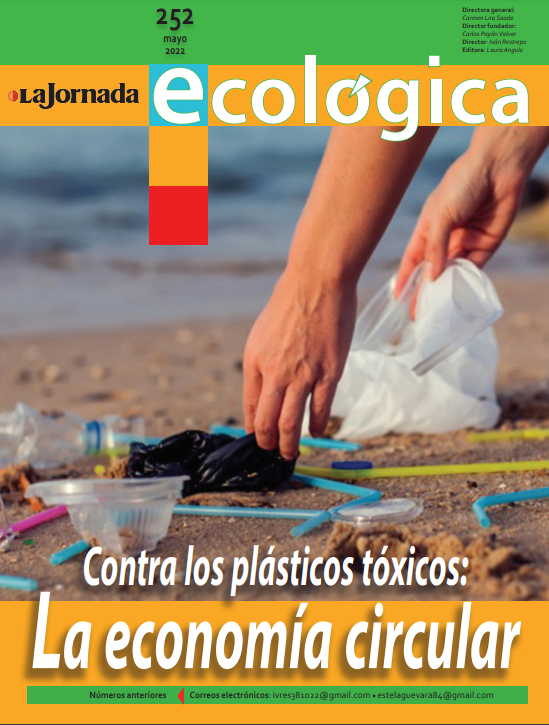
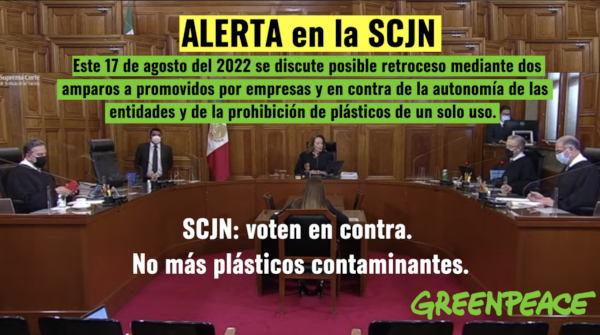
In addition, we see with concern that the legislative branch has promoted reforms to the national waste legislation and initiatives for new laws, which encourage the industry to continue producing toxic plastics, such as the proposed General Law of Circular Economy, which disguises the incineration of plastics as "recycling". Added to this scenario are the rulings of the Supreme Court of Justice of the Nation in favor of the soft drink companies, which protects them from complying with state legislation that prohibits single-use plastics.

All of this shows not only a lax stance toward the necessary regulation and reduction of the production, consumption, and disposal of plastic waste in the country, but also a policy that has not addressed the problem of exporting this contaminated waste from other countries to Mexico.

Total exports of plastic wast to Mexico by origin

Source: Own elaboration based on systematized data from the Sistema de Información Arancelaria Vía Internet de la Secretaría de Economía (Tariff Information System via Internet of the Ministry of Economy, SIAVI)

Where Is Plastic Waste Imported From?

This section shows the countries that exported plastic waste to Mexico from 2015 to October 2021.

Photo: GAIA.

According to data from the Sistema de Información Arancelaria Vía Internet (SIAVI), from 2015 to October 2021, 662,518 tons of plastic waste have been exported to Mexico.

Annual exports practically tripled in this period, from 58 thousand 243 tons in 2015 to 175 thousand 586 tons in 2021. During this period, 94% of the volume of plastic waste exported to Mexico comes from the United States, while Italy, Germany, the Netherlands, and China together account for another 3% of the total volume.

Main Countries Exporting Plastic Waste to Mexico from 2015 to 2021

Subheading 39159099 (Other plastics) accounts for more than one-third (38%) of total plastic waste exports to Mexico from 2015 to 2021.

The subheading that increased the most in volume from 2015 to 2021 is 39159002 (Ethylene terephthalate -PET- or PET offcuts, PET ethylene terephthalate PET) going from 2 to 67 thousand tons.

By 2021 this subheading (Ethylene terephthalate -PET- or PET parings) the one with the highest export volume with 38% of the total. It is important to note that for this same subheading, the growth rate was 3,181% for the entire period from 2015 to 2021.This significant increase is effectively explained by the increase in exports of these PET wastes and parings, but also since in 2015 the export volume of this subheading was very low. The largest increase is observed between 2020 and 2021, where the export volume doubled, as shown in the table below.

Increase in the volume of plastic waste exported to Mexico by subheading from 2015 to 2021 (tons)

(*) Hover cursor on the subheading number to show description.

Year Total
202125,190,1291,660,90418,261,343154,52667,863,03762,456,042175,585,981
202025,672,7783,319,06716,661,98437,43738,528,96545,164,756129,384,987
201918,042,1153,906,55319,274,39541,2427,628,09929,645,51478,537,918
201821,230,7494,544,92419,000,725234,5421,307,22132,972,41279,290,573
201717,234,7554,038,59018,514,189576,3972,035,18032,219,36474,618,475
201616,953,6242,720,33416,711,121515,8264,069,80425,886,27466,856,983
201512,358,0103,809,31617,146,503263,1342,068,42922,597,65758,243,049
Total136,682,16023,999,688125,570,2601,823,104123,500,735250,942,019662,517,966
% total 2015 - 202121%4%19%0%19%38%100%
% total on 201521%7%29%0%4%39%100%
% total on 202114.3%0.9%10.4%0.1%38.6%35.6%100%
Growth rate 2015 - 2021103.8%-56.4%6.5%-41.3%3180.9%176.4%176.4%

Source: Own elaboration based on systematized data from the Sistema de Información Arancelaria Vía Internet de la Secretaría de Economía

The total value of exports to Mexico in dollars went from $25,4 million in 2015 to $35,3 million in 2021, for a total of $200 million during those 7 years.

In this time lapse, the average value of exports has decreased from US$436 per ton in 2015 to US$201 in 2021, 76% of the total value from 2015 to 2021 is related to exports from the United States, followed by Guatemala (14%), Italy (2%), Germany (1,6%), and China (1,3%).

Significant differences exist in the average value of exports by country of origin. In 2021, Guatemala was the country with the highest average value at US$2,982 per ton, followed by other Latin American countries such as Puerto Rico (US$1,114 /ton) and Colombia (US$823 /ton) while those from the United States had a value of US$166 /ton and those from the Netherlands US$331 /ton. The reasons for these differences have not yet been determined.

Despite "only" representing 35% of the total volume in 2021, subheading 39159099 (Other plastics) represents 68% of the total value for the same year. Subheading 39159001 (Of articles/manufacturing of polymethyl methacrylate) has the highest value by volume with USD 531 per ton in 2021, followed by 39159099 with USD 382 /ton and 39152001 (Of polymers of styrene) with USD 304 /ton.

This map shows the countries that exported plastic waste to Mexico between 2015 and 2021. It has two views: map and globe. when you click on a country, a graph with the evolution of exports by tariff subheading appears. The map allows you to change the visualization by year and by volume (kg) or value (USD).

From 2015 to 2021, 51 countries exported plastic waste to Mexico. The map shows large disparities in export volumes by country: the U.S. accounts for 94% of the total volume and, considering the other 4 countries marked in red on the map, these five countries send 97% of the total plastic waste that Mexico imports. the other 46 countries only account for 3% of total exports.

76% of the total value from 2015 to 2021 is related to exports from the United States, followed by Guatemala (14%), Italy (2%), Germany (1,6%), and China (1,3%).

The Case of the United States

This section shows the predominant role of the United States in its exports of plastic waste to Mexico. According to SIAVI data, in 2015, the USA exported 91,5% of the total volume of imported plastic waste by Mexico, and in 2021, this volume grew to 95,4%.

Photo: GAIA.

The United States is the principal exporter of plastic waste to Mexico

The shipment of plastic waste, scrap, and parings from the USA to Mexico has been increasing. Between 2015 and August 2022 alone, the United States reported having shipped almost 390 thousand tons of plastic waste to Mexico, considering only the five types of plastics (subheadings) grouped under HS code 3915 relating to plastic waste, scrap, and parings.

According to official USA Trade statistics, the year with the highest flow of these wastes to Mexico was 2021, with a shipment of 84 thousand tons of plastic waste.

Polyethylene terephthalate (PET) is the type of plastic waste with the largest shipment volume. In 2020, it quadrupled the volume shipped the previous year (2019), going from just over three thousand tons, to more than twenty thousand. By 2021, it was more than 38 thousand tons.

Overall, the most shipped type of plastic in the period under review was the ambiguous category 391590, which is grouped as "other plastics" (40%), followed by polyethylene terephthalate (PET) (24%), vinyl chloride polymers (17%), ethylene polymers (14%), and styrene polymers (5%).

In the official information, in addition to the volume (weight) of waste, scrap, and plastic parings exported from the U.S. to Mexico, there is information on the value of these exports. It should be understood that this data only shows the value represented by this transfer of waste and that it is a value that is retained by the companies involved in the export/import.

It is worth noting that, according to the General Import and Export Tax Law, tariff code 3915 contains taxes on imports from other countries and exempts all exports. The flow of plastics between Mexico and the United States is not taxed. This is due to the tariff exceptions provided by the Free Trade Agreement between Canada, the United States, and Mexico (T-MEC).

Thus, according to the list of tariff fractions of the T-MEC, HS code 3915 is duty-free for both imports and exports. This means that from the value mentioned here, related to plastics imported by Mexico from the USA, none of this amount of money is transferred to the State. However, importing plastic waste results in a set of socio-environmental problems that could generate costs to the government public spending, due to health expenses and treatment of contaminated sites.

Between 2015 and August 2022, the export of plastic waste from the USA to Mexico represented a value of US$225 million, and again, the most important tariff fraction was "other plastics". A subcategory in which various plastics are grouped together that obviously cannot be classified and differentiated, which can be more harmful to health and the environment.

It draws attention that the value represented by the import of the rest of the plastic waste is quite minor (almost 78 million dollars between 2015 and August 2022), given that "other plastics" represents 66% of the value in that period for 147 million dollars. Where does this waste go? Why are more mixed and unsorted plastics imported than those separated by a single type of plastic? Is it perhaps because they are mainly directed at co-processing and incineration?

Volume (kg) of plastic imported to Mexico from USA, by subheading

This map shows the U.S. cities from which U.S. plastic waste is exported to Mexico. The dots with which the cities are marked are proportional to the volume of plastic waste exported from each of those cities to Mexico. Clicking on a point shows a graph of the types of plastic waste exported. The map allows you to change the visualization by year.

Most of the plastic waste exported to Mexico was shipped from land bordering cities, particularly San Diego in California (49% of the total plastic waste exported to Mexico between 2015 and 2022 left from this city), followed by Laredo in Texas (41,8%) and El Paso in Texas (5,5%).

This does not mean that these cities produce or consume these plastics, but only that they are the ports of exit from the United States to Mexico. From these four cities, 98% of all plastic waste shipped to Mexico between 2015 and August 2022 was exported.

It is remarkable that the volumes indicated by USA Trade do not coincide with those indicated by other sources. According to DATASUR, in the same study period, the most important customs office for the volume of plastics imported from the United States was Tijuana (BC), followed by Nuevo Laredo (Tamps), Reynosa (Tamps), Cd. Juarez (Chih), Mexicali (BC), Cd. Acuña Coahuila and Nogales (Son).

Volume of plastic waste imported into Mexico between 2015-2022 through the 7 main points of entry

Source: Own elaboration with data from DATASUR.

Volume of exported plastic waste 2015-2022 from the top 10 USA outbound cities

Source: Own elaboration with data from USA TRADE.

In addition to the lack of certainty and clarity about the final destination of this waste, another factor that aggravates the situation is that, as we have said, in the T-MEC, fraction 3915 corresponding to plastic waste is free of tariffs, which encourages its shipment and perpetuates Mexico’s subordination to the United States as the country that receives the region’s garbage.

Where does waste get into Mexico from?

This section shows the ports of entry of plastic waste imported into Mexico from different countries, mainly from the United States.

Photo: Chutternsnap in Unsplash.

The main waste points of entry are in Tamaulipas, Baja California, and Chihuahua.

According to DATASUR data, 96% of the plastic waste volume imported into Mexico under the classification HS code 3915 came from the United States. Despite that, it should be noted that, although in a much lower proportion, Mexico imports plastic from other countries as well. For example, the Netherlands (which imported 0,64% between 2015 and 2022), China (0,62%), Germany (0,51%), Italy (0,37%), and Puerto Rico (0,31%). 73% of the plastic waste enters the country by road, 20% through “land” (sic), and 5% by sea.

Of the total volume of plastic waste imported into Mexico, 46,6% was imported through the Tamaulipas point of entry, 33,6% by Baja California, and 10% by Chihuahua

For all plastic waste, the main points of entry were Tijuana, Baja California (from which 26,7% of all imported plastic waste entered during study), Nuevo Laredo, Tamaulipas (24%), and Ciudad Reynosa, Tamaulipas (19,4%), Ciudad Juárez, Chihuahua (10%), Mexicali, Baja California (5,9%), Matamoros, Tamaulipas (3,1%) and the Veracruz port (2,4%). These seven points of entry alone imported 92% of the entirety of plastic waste during the study period (2015–August 2022).

Volume of plastic waste imported by Mexico, from 2015 to 2022 by the seven main custom points of entry

Surprisingly, in terms of the import price of all plastic waste that entered between 2015 and August 2022 (FOB price), the distribution changes slightly. Although Tamaulipas increased their import volume to almost 51%, the distribution of the remaining volume is not as concentrated. As to the total price of the imported plastic waste, Baja California has 31% , followed by Chihuahua with 7,5%, Veracruz with 3,9%, Coahuila with 2,2%, Colima with 2%, and Sonora with 1%.

Even though the names of the importing and exporting companies running the waste exported to Mexico are of public knowledge, this information is not enough to know where the plastic waste is headed or what recycling processes, final disposal, landfills, incineration, or co-processing are implemented. Furthermore, the environmental and economic authorities do not disclose this.

The lead of those tons of imported plastic is lost when entering the country. Between 2015 and August 2022, there were 231 different companies that imported plastic waste. Many of them are subsidiaries of the same parent company; however, the relationship between exporting and importing companies may give a hint to follow this lead regarding the destination of the imported plastic waste, but it is still not enough.

It is important to point out that the Mexican government promotes the import of plastic waste, for instance, when Semarnat (Mexican Ministry of Environment) decides not to regulate the import of “presumably not hazardous” plastic. This represents one of the most concerning classifications of the HS code 3915 (39159000 Waste, Parings and Scrap, Of Plastics, Others/Nesoi) because those plastics are not a subject of clean recycling; therefore, they are burned in cement kilns (co-processing).

This map shows the points of entry through which plastic waste enters Mexico. The size of the dots is proportional to the volume of plastic waste received at the points of entry. Clicking on each dot displays a graph showing the types of plastic waste imported. The map allows you to change the visualization by years.

Of the total plastic waste imported into Mexico, 46,6% have been imported by point of entry in Tamaulipas, 33,6% by Baja California, and 10% by Chihuahua.

Considering the total plastic waste, the main points of entry are Tijuana (26,7%), Nuevo Laredo (24%), Ciudad Reynosa (19,4%), Ciudad Juárez (10%), Mexicali (5.9%), Matamoros (3,1%), and Veracruz (2,4%).

These seven points of entry alone imported 92% of all plastic waste during the study period (from 2015 to August 2022).

Where does the waste go?

According to the Organization for Economic Co-operation and Development (OECD), approximately 91% of accumulated plastic in the world ends up in dump sites, or landfills where it eventually migrates or gets burned. Recycling has shown not to be a real solution to the waste problem,  since it tackles barely 10% of plastics.

Photo: GAIA.

Incineration and co-processing of plastic in Mexico

Incinerators produce thousands of harmful chemical substances: heavy metals such as mercury, chromium, cadmium, arsenic, lead, and beryllium; polycyclic aromatic hydrocarbons (PAHs); chlorinated benzenes; polychlorinated naphthalenes; volatile organic compounds (VOCs); acid gases such as sulfur oxides; nitrogen dioxide; and hydrochloric acid gasses such as carbon dioxid.

Mexican environmental regulations allow waste burning, including hazardous waste and plastic, in cement kilns and consider it as “recycling”. Co-processing (burning waste as an “alternative” fuel in cement kilns) is highly toxic because of the gases and emissions formed during combustion. In addition, the accumulation of toxic additives contained in plastic. This contamination present in the air, water, and soil has been damaging the environment, human health and territories - recognized as “environmental hell” by the official environmental authorities of neighboring communities for many years. This is why waste valorization by burning and co-processing contradicts the world efforts to establish incineration as the last resource in waste and plastic management and that burning toxic waste must be avoided at all costs.

In this section, you can see the location of the companies and facilities registered in Mexico that recycle, valorize, co-process, and incinerate hazardous industrial waste.

Recycling facilities and companies: according to Semarnat’s records, there are 200 authorized recycling facilities and companies, of which 165 could be tracked and are visible in the following map, (the other ones have inaccurate addresses or refer to a fiscal or corporative address and not to a recycling site). Nonetheless, most plastic waste imports are not classified as hazardous waste. This information shows that only 9 companies control half of the total volume of recycled hazardous waste. Those companies are: Geocycle Mexico, with (993, 700 tons, which corresponds to 14% of the total); Johnson Controls Enterprises Mexico, (590,085 tons, 8,3% of the total); Lim del Puerto/ Logística, Ingeniería y Mantenimiento del Puerto, (500,000 tons, which is 7,1% of the total); and Sociedad Ecológica Mexicana del Norte, (356,500 tons, that is, 5% of the total volume).

Waste recovery facilities and companies: there are 7 waste valorization facilities and companies, within which we can find Comisión Federal de Electricidad, because of the processes in two of its carbon-fired and thermal power facilities, some sugar cane mills, and other industries.

Co-processing facilities and companies: there are 34 co-processing facilities for cement companies. CEMEX is the company with the most registered waste burning sites (14 facilities), followed by Holcim (7 facilities), Cementos Moctezuma (3 facilitiess), Cementos Fortaleza, and GCC Cemento (2 facilities each). Energía Térmica Ambiental, Grupo Azinsa, and INASA (1 facilities each).

Treatment facilities and companies: there are 73 authorized facilities for hazardous waste treatment, of which 57 are visible on the following map (the other ones have inaccurate addresses or refer to a fiscal or corporative address and not to a treatment site). Of those 73 facilities, two control 99,8% of the total volume of hazardous waste treatment: Tecnología Ambiental Especializada, S.A. de C.V (68,8%) and Ternium México, S.A. de C.V (31%).

Incineration facilities and companies: there are 12 authorized companies that incinerate hazardous waste. The companies with the largest incineration capacity are PEMEX, through its Pemex Etileno plant in Coatzacoalcos, which has a capacity of 36,500 tons/year; Klinash (26,280 tons/year for its Lerma plant); Sistemas Integrales en el Manejo de Residuos Industriales; and Respel Ambiental (with a little less than 13,000 tons/year for each plant).

Company activity
Waste recycling
Waste recovery
Waste co-processing
Waste treatment
Waste incineration
Plastic recycling (ENF)

This map shows Semarnat authorized companies according to their category and ENF recycling facilities. When clicking on a dot, you can visualize every companys specific information (authorization number, issuance and expiration date of said authorization, type of waste processed, etc.).

Here you can observe the locations of the companies organized near the biggest cities of the country, such as the metropolitan areas of Mexico City, Monterrey, and Guadalajara.

The increase in plastic exports into Mexico coincides with the creation of new plastic burning programs (see case studies), which enhance and aggravate the environmental crisis, the violation of the communities' human rights, and the deceit of the so-called circular economy. In Mexico, burning equals recycling.

Case studies

This section presents case studies that highlight the impact of plastic waste colonialism.

Photo: Lidecs/FCCI.

Environmental Hell, Corporations, and False Circular Economy Solutions.

To maintain the high temperatures of their kilns and lower their production expenses, cement companies have gone from using fossil fuels (coke, gas) to incinerating waste (co-processing). Since 2013, Semarnat has authorized cement kilns to burn waste. This authorization to burn waste ranges from 30% to 80% as alternative fuels. The permit with the longest effect in this list is valid until 2031. In fact, there is a facility with an indefinite permit. In 2020 alone, CEMEX calculated a burn of 12,4 million tons of burned waste to power its operations and set the incineration of 19 million tons as a goal for its total usage by 2030.

To reduce energy costs, cement companies promote co-processing, valorization, and thermal treatment as false solutions by proposing the implementation of “recycling” and other climate alternatives instead of using fossil fuels. This is merely greenwashing logic. Environmental issues, cement companies' activities, and co-processing are on the rise, as are their socio-environmental conflicts due to greenhouse gas emissions (GHG), persistent organic pollutants (POPs), heavy metals, and other toxic substances such as additives on plastic that cause hormonal, cognitive, and immunological alterations.

The following case studies, which provide a glimpse of what is happening throughout the country, show the scope of the impact. Click on each one to open its information in a new tab.

Cement companies in the Tula–Apaxco–Atotonilco corridor: Sacrifice zone
Description

Six of Mexico’s more than 30 cement companies are located in the Tula–Atotonilco– Apaxco industrial corridor. The Tolteca region of the Tula River, Río Seco and Mezquital Valley between Estado de Mexico and Hidalgo, is recognized as one of the sacrifice zones in Mexico with the highest environmental devastation and negative health effects for decades, which affects its territory due to the high concentration of extractive, energy, and cement industries. There are eight cement companies in Valle del Mezquital that produce 40% of the country’s cement.

Tula-Apaxco-Atotonilco indusrial corridor.
The new “neutrality of plastics”. Corporate agreements with Geocycle for co-processing.
Description

As described above, burning plastic waste in cement facilities is not new, but now companies are using a new false discourse of greenwashing of "circular economy", using incineration as the best recycling alternative and calling it the new plastic neutrality.

Direct Pack Mexicali: Intensifying Waste Colonialism in Mexico
Description

In 2023, the US company Direct Pack Recycling announced the operation of a new PET recovery/recycling plant in Mexicali, Baja California, for the manufacture of pellets and thermoformed packaging (cups, lids, trays), financed by The Recycling Partnership Coalition, which clearly indicates the intensification of colonialism through plastic waste coming from the United States into Mexico.

Mexicali, Baja California.
Single- use plastic ban in Oaxaca
Description

Oaxaca was one of the local congresses that legislated the ban of single-use plastics, including polyethylene terephthalate (PET) and expanded polystyrene (EPs), as a protective mechanism for the environment and to stop the plastic crisis in its territory.

Oaxaca state.

What to do?

Conclusions, proposals , and resources.

This section presents some conclusions and proposals for confronting plastic waste colonialism in Mexico. This includes infographics, macros, and other resources that go deeper into this problem.

Photo: Rommel Cabrera / GAIA

INCINERATION IS NOT RECYCLING, AND RECYCLING IS NOT ENOUGH AND HAS PROVEN NOT TO BE THE SOLUTION

The only way to stop generating plastic waste is to stop consuming it and actively promote a ban on single-use plastics locally. Any thermal and chemical treatment given to waste plastics and other wastes is not recycling. So-called energy recycling, energy recovery, co-processing are disguised forms of incineration and should be avoided.

It is urgent that Mexico design national public policies aimed at addressing and reducing plastic pollution throughout its life cycle, from the extraction of raw materials for production to its final disposal. Environmental legislation on waste must change its focus from valorizing waste to preventing its generation through a precautionary principle. Plastic waste from the United States does not have to pollute the country. If Mexico does not recycle even 10% of its plastic waste, why import U.S. plastic waste? Strong and bold actions need to be taken like those of the Canadian government in classifying plastics under its environmental legislation as toxic.

We must actively demand a ban on imports of toxic and contaminated plastic waste into Mexico, since most of it cannot be recycled, so it ends up being incinerated, burned in cement kilns, in landfills, bodies of water, oceans, protected natural areas, in the city, in the countryside, deteriorating the environment and causing human health harm.

The United Nations Special Rapporteur on the implications for human rights of the environmentally sound management and disposal of hazardous substances and wastes, points out that IT IS THE DUTY OF STATES TO PREVENT EXPOSURE TO TOXIC SUBSTANCES AND HAZARDOUS WASTES, noting that prevention of exposure to these toxins has been the exception, resulting in real threats to life and health, including reproductive health; and that HUMAN BEINGS EAT, DRINK AND BREATHE PLASTIC, due to the increase in plastic production, incineration and waste disposal has only exacerbated its impact on human rights and the environment, as well as the need to move toward a chemically safe circular economy.

¡PromoteZERO WASTE plans in your locality and protect the work of waste pickers. Zero Waste excludes waste incineration!

RESOURCES

Haz clic para descargar.

INFOGRAPHS

MACROS

OTHER RESOURCES


This work is under Creative Commons 4.0 International License: Attribution - Non-Commercial - Share Alike.

The content can be shared, copied and redistributed in any medium or format.

Go home